


Despite the enthusiasm of politicians and investors for a green energy transition, complex activities need to be aligned to achieve success – or to avoid the catastrophe of undermining the U.S. energy system without providing an adequate substitute. An insight from the turn of the century can offer some clarity, and a dose of reality.
In the early 1900s, an American engineer, Henry Gantt developed a chart that visually linked start and end dates for different tasks. He illustrated what tasks could be done in parallel and those tasks that could not start until others were complete. At a minimum, a national level Gantt chart today would illustrate the need to align the production of massive new levels of electricity from renewables with the transition to electric vehicles, home heating, and more.
A further alignment of tasks would include domestically sourcing and processing critical minerals, breaking ground on new factories, creating utility-scale renewable power generation, new transmission and distribution capabilities, and developing a new electric grid able to operate and backup intermittent renewable power on a nationwide basis. None of those things exist today.
Consider just three examples related to the EV transition alone.
Some of the federal government’s newest rules related to EVs require that batteries contain critical minerals sourced or processed in the United States or in allied countries with which we have a free trade agreement. Not only would a Gantt chart show the timing associated with establishing mines or processing facilities for, let’s say, lithium here and in partner countries, it would also consider the time required to complete a free trade agreement. The Treasury Department’s rules are ambitious: it just announced that in 2023 40 percent of a battery must meet the above criteria. By 2027 – in three years – that percentage jumps to 70 percent! Recent reports show that China is actually projected to increase is its control of lithium mine production, from 194,000 tons in 2022 to 705,000 tons by 2025.
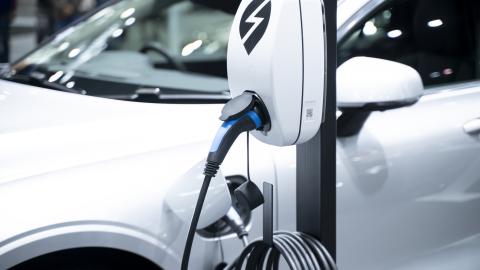
Now consider charging stations. As the mandates for EVs grow - given the new rules forcing trucking companies and government fleets to electrify – how do these mandates align with the charging stations that are needed, given production capacities and permitting requirements?
Public charging stations have increased in number; some say by 40 percent since 2020, putting us at just over 55,000 today. But that’s far from the White House goal of 500,000 new public charging stations in seven years. Moreover, many analysts point out that even the projected number is not enough and that the real need is well over one million. Charging stations can’t just pop up: they must comply with the federal National Electric Vehicle Infrastructure (NEVI) program, adding billions in costs and time. Moreover, it is not just any type of charger. As the Edison Electric Institute explained, fast-charging infrastructure is critical to providing drivers with the confidence they need to make the switch to an EV. Family road-trippers (think the Griswalds in Christmas Vacation) want quick chargers in convenient and safe locations. What family wants to add time to a trip?
All of this will put lots of pressure on the electrical grid, suggesting a third opportunity for Mr. Gantt’s chart. The existing grids are made up of generation plants, transmission lines, and distribution centers. Grid operators must balance the supply and demand for electricity. Adding more electricity demands to the grid – some of which dates to the 1900s – could exceed its capacities. The EV transition could double the demand for electricity. Imagine if everyone charges their cars at the same time, after their daily commute. Some experts point out that it will require investments up to a trillion dollars to update the grid to absorb the future requirements of a more electrified energy system. What do the timelines for these updates look like, given the supplies of equipment and other inputs?
These examples highlight the risks of an attempt to transition away from fossil fuels without the discipline of a Gantt chart. Years ago the complexity of the data required for such an endeavor would have been nearly impossible to collate. Yet even before the explosion of ChatGPT we have had ability to gather and analyze reams of regulatory, legal, and geospatial data
In 1922, a contemporary of Mr. Gantt, explained that the chart aimed to present facts so that they could be understood in relation to time. As hundreds of billions of dollars are now being committed to new climate-related projects, with top investors bullish on the U.S. leading the world in renewables investments, applying a technique invented in 1910 could help bring us up to date and impose a needed dose of reality.